
%20(1).jpg)
Rural, mountainous and hilly areas present a unique challenge to traditional bus operators. The steep gradients, narrow and winding roads make it difficult to service suburbs that are built into the side of a hill with large vehicles and fixed routes. This isn’t just because some of the areas may be inaccessible to a vehicle, but it significantly decreases the range in which people are willing to walk to the bus route—especially if that person is in some way mobility impaired. This usually leads to individuals driving their cars to get to their destination and consequently not utilising Public Transport.

Today, we’ll dive into some data-driven examples to unpack how this plays out in modern day society, and how it affects day-to-day life for many rural residents.
This article will cover:
"Boldly go where large buses can’t."
A Modern Day Example
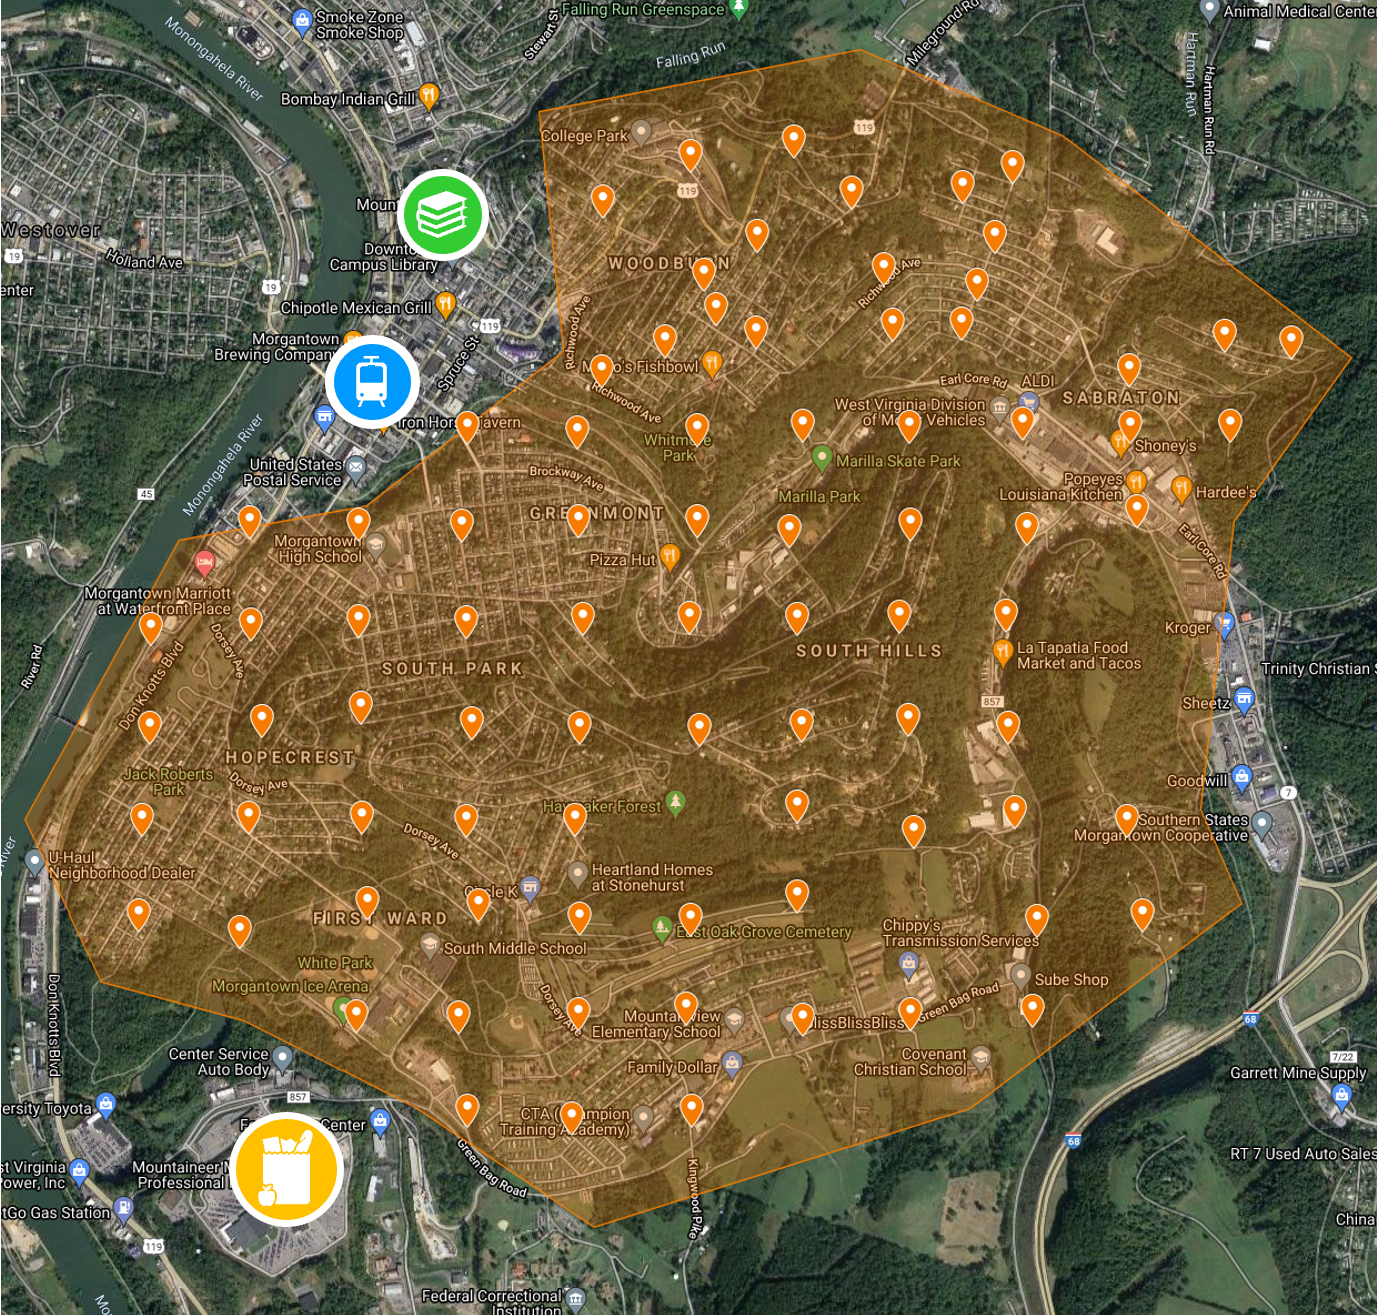
An example we’ll review today is the town of Morgantown, WV, USA. The zone shown below covers a set of suburbs built into the side of a fairly steep hill.The zone was selected due to demographics, current public transportation usage and its proximity to a major transportation hub for the city, the WV University’s PRT (Private Rapid Transportation).
Conducting a TransitScan
I’ve conducted a scan over this area to determine the accessibility of the Public Transportation in this area. First, we assessed how easy it was to get to the PRT station in town by using Public Transportation. We analyse the walking distance and travel time on Public Transportation when compared to driving, to assess the accessibility. See below:

Unsurprisingly, the chart shows that people who live at the base of the hill are able to walk quite easily to access Public Transport. However, as you go up the hill, the ability to access Public Transport increases in difficulty. This difficulty is also confirmed in the recent census data, where the estimated percentage of workers using Public Transport to get to work in this region was so low they were unable to provide an estimate!
The difficulty to access Public Transport in this area poses disadvantages to all that live in the area as they have a reduced set of mobility options. For example, if they want to get somewhere in a reasonable amount of time, they have to drive. The impacts of this can be felt even more by households who have no vehicles available to them (10.7%), households with only one vehicle available to them (41%) and people who are mobility challenged or are persons with a disability (11.1% of the population). Just take a look at the Public Transport to Driving ratio:
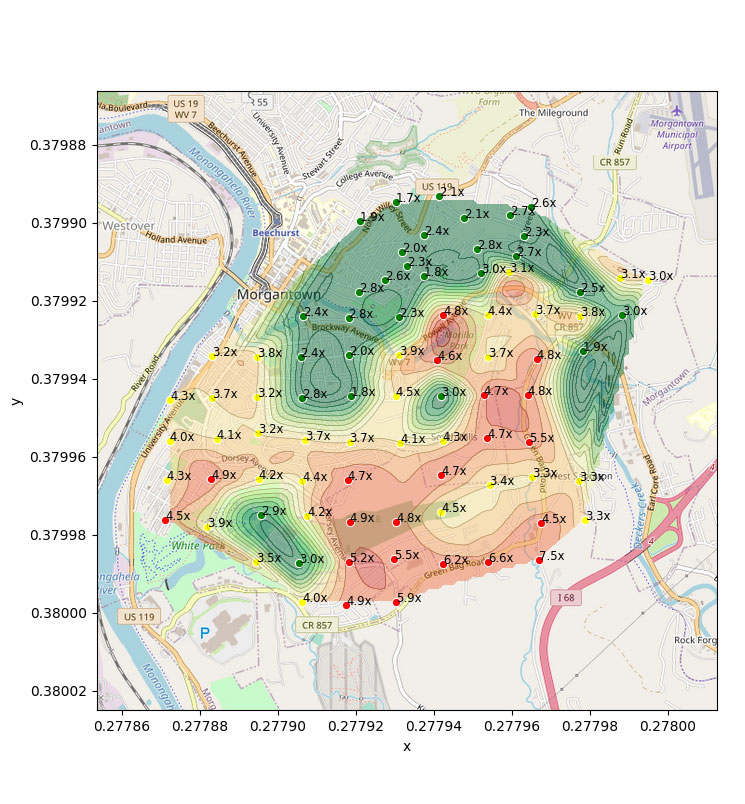
When viewing the time it takes to use Public Transport when compared to driving to get to a destination, we can see that it can take up to 7.5 times longer than driving (walking time included). For your average person, for what is normally a 10 minute drive, spending over an hour to try and take the Public Transport option just isn’t even a consideration. This is where we believe Demand-Responsive Transport can make a drastic improvement.
Simulating a DRT Service
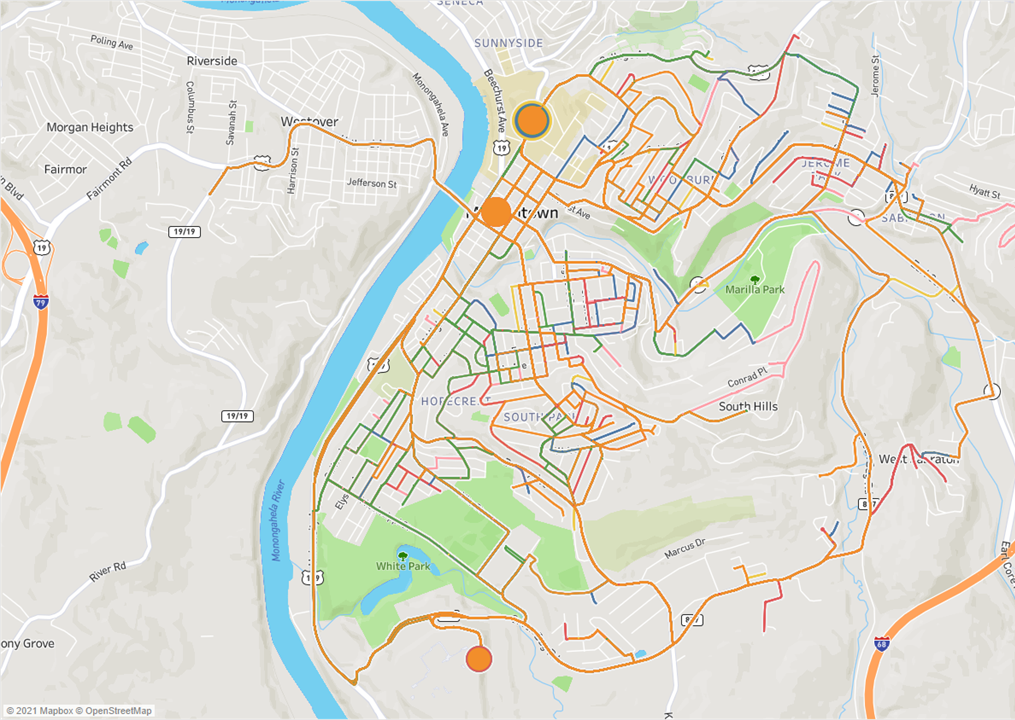
To find out what benefits can be derived from changing the Public Transport model from a fixed to a more demand-responsive model, as a Data Science team we simulate what a service would look like in the area and analyse the difference it would make to the population.
For this specific simulation, we set up a door to hub service to completely eliminate any walking required by the client. We ran three to six, eight seater vehicles around the zone for varying demand levels to ascertain service levels and generate a growth model for the region. The eight seater vehicles were chosen as they were more nimble and efficient to run in the locality chosen.
The participants would have a choice of three main hubs they could travel to, the end of the line PRT station, University Ave and the Mountaineer Mall. From these hubs, people would be able to access the majority of their day to day needs—including employment, health, transport, entertainment and shopping.
The Simulation Results
The results indicated that a Demand-Responsive Transport service could be operated in the zone using between 4 to 6 vehicles, depending on the demand. Using the vehicle estimator below, the DRT service could start with four vehicles and service approximately 200 requests per day at an 82.9% success rate. As the service grows to 300 bookings per day, an additional vehicle would be required to maintain a pick up success rate of over 80%. In the event of the service growing up to 400 to 500 requests per day, a sixth vehicle would be required.
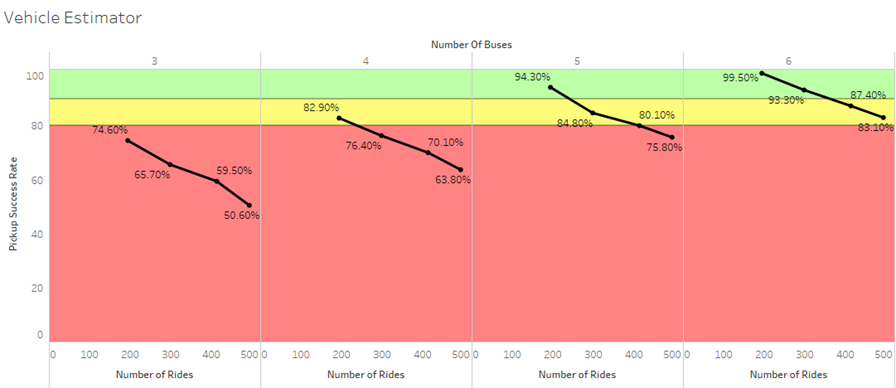
This is a vehicle estimator. Each point in the chart represents a separate simulation. The top axis shows the number of vehicles that were used in the simulation, the bottom axis shows the number of requests that were made during the simulation, and the y axis measures the pick up success rate, i.e. what percentage of the rides that were requested were we able to service?
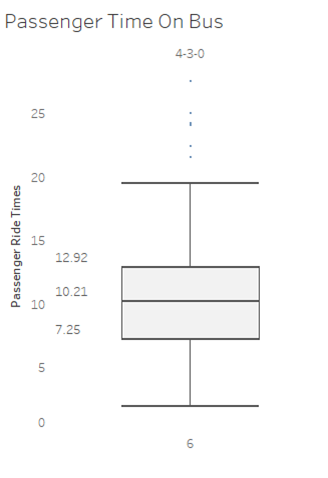
As the vehicles are now able to provide users with a more direct service than Public Transport, along with the added benefits of removing the walking time, travel times using the service were drastically improved. 75 % of the journeys taken were 12 minutes from pick up to drop off for the passenger, with 50% of trips falling under the 10 minute mark.
This reduction in both walking time and travel time will increase the likelihood that people within the zone will consider DRT a variable form of Public Transportation as it removes some of the barriers to its usage.
To Conclude
Providing Public Transport in difficult to reach areas for traditional services, like steep hillsides, can be provided more effectively and efficiently via the use of Demand-Responsive Transport. Using DRT in these regions allows for a higher population participation rate in Public Transport and the wider community, giving opportunities to people where before none existed.

Encouraging Public Transport usage in rural communities is an imperative strategy in reducing emissions, with road vehicles causing 80% of transport emissions. Thus, implementing innovative ways with the help of technology to combat transport disadvantage and poverty that occurs from a lack of access to transport, can be achieved with the integration of demand-responsive systems.
If you’re looking into ways to see if a particular zone could benefit from Demand-Responsive Transport, simulation is a great way to build confidence, de-risk a new idea and evaluate their current transportation services.